Short answer
Select a TFT LCD for test and measurement equipment around the information users must interpret: numeric results, units, traces, status indicators and controls. Resolution, viewing angle and host compatibility are separate decisions. Evaluate them with the actual instrument interface and complete front stack, then validate display behavior alongside the instrument's acquisition and processing workload.
A higher-resolution LCD can render more visual detail, but it does not by itself improve the accuracy of the measurement chain. The display's pixel count, the instrument's sampling behavior and the user-interface update rate must not be presented as interchangeable specifications. This guide concerns display integration, not calibration or a claim about any instrument's measurement performance.
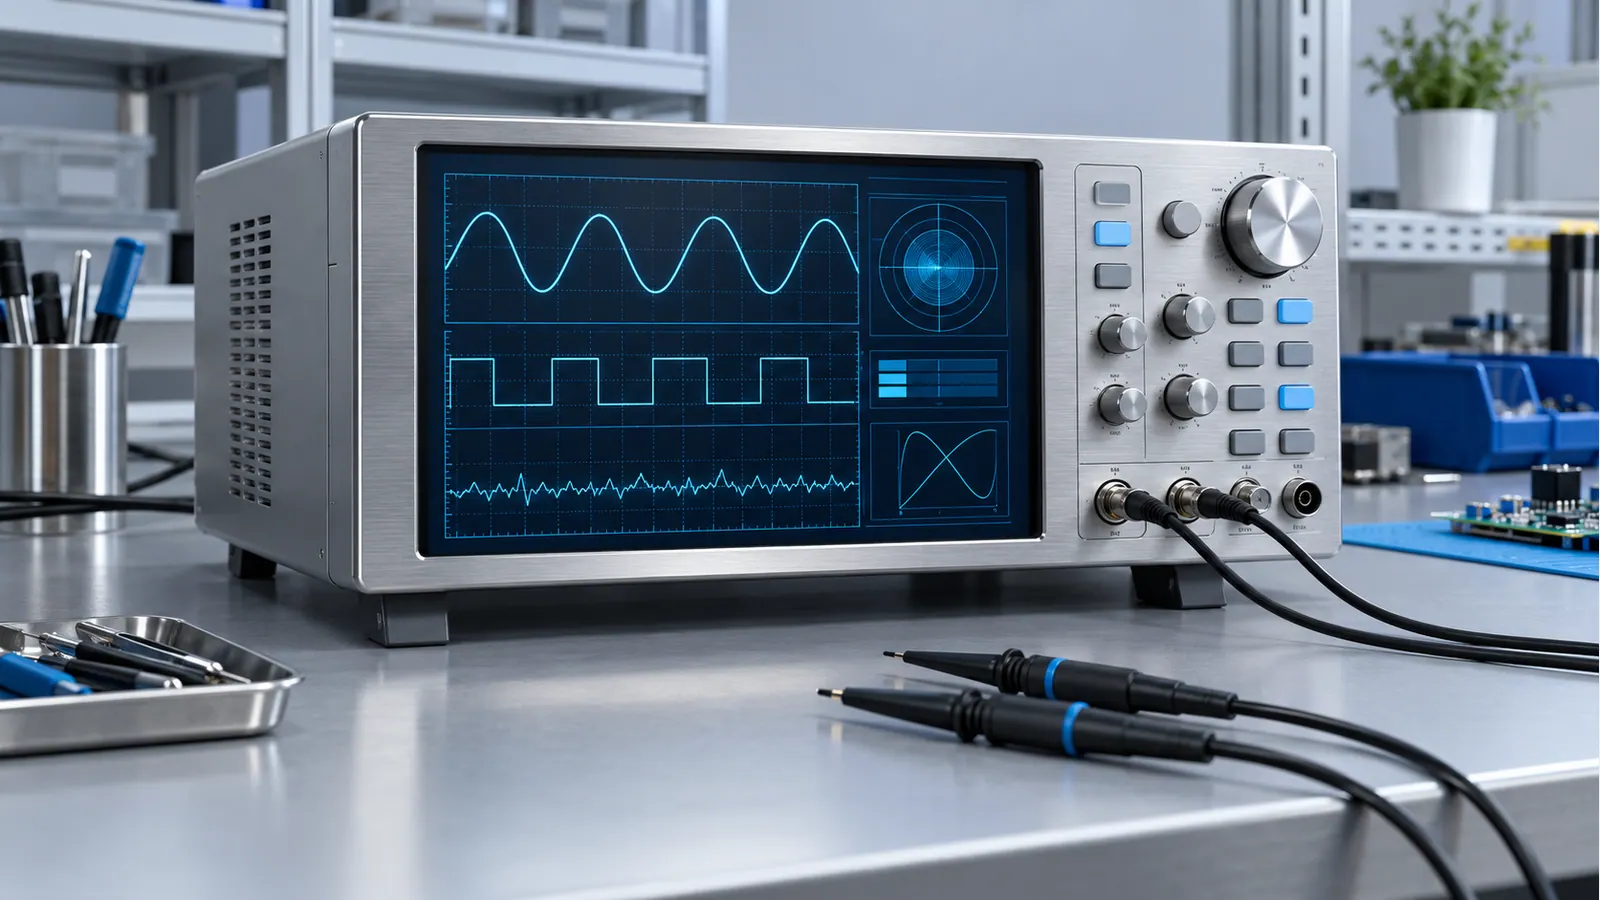
Keep acquisition, graphics and the panel in separate boxes
For a trace-based instrument, distinguish acquired data from the picture drawn from it. The acquisition system captures and processes the signal. The graphics software selects how to present that information. The LCD receives a rendered image through its video link. Touch, if present, uses a separate input path to the host.
Tektronix's explanation of oscilloscope operation describes the sampling clock, ADC and acquisition memory as parts of acquisition. That helps distinguish them from the LCD. Changing panel resolution is not evidence that an instrument has acquired additional samples or improved its specified measurement uncertainty.
Document the distinction in the product requirements. State the native LCD resolution, required interface responsiveness and the acquisition or processing constraints independently. If a trace is simplified to fit the visible plotting area, the rendering approach belongs to the instrument software. Do not imply that each screen column always represents exactly one acquired sample.
Start with the most demanding real screen
Build a representative screen containing the maximum necessary trace count, axes, units, results, status indicators and open controls. Include long translated labels, negative values and the intended decimal precision. The display should help users distinguish a value from its unit and understand whether a result is current, held or unavailable.
Review physical text size at the intended distance. A bench instrument viewed while seated has different geometry from a rack instrument inspected while standing or a handheld device used in the field. Increasing pixel density without adjusting software scaling can make controls and text physically smaller. Decide whether additional pixels will improve rendering quality or allow more content, and test that choice.
Inspect the plotting area's actual dimensions after menus and status areas are included. A panel with many pixels may still leave little space for traces if the interface reserves most of the screen for controls. Test cursors, thin lines, overlapping traces and result panels using the intended graphics library, not a specially prepared marketing image.
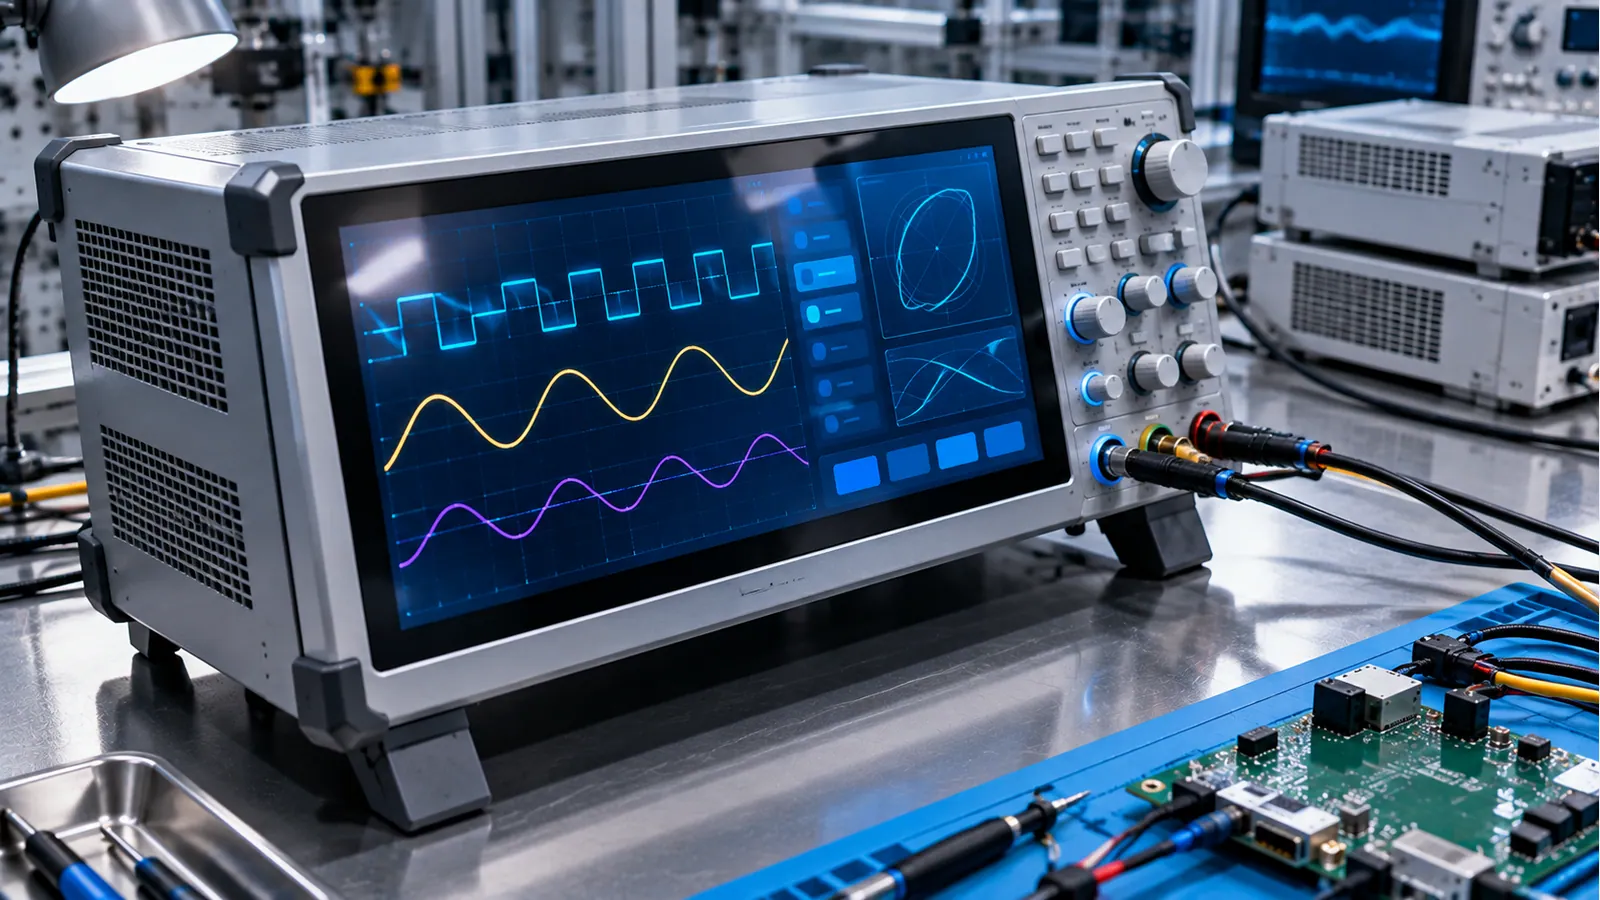
Compare display choices by the job they must do
The table is a selection framework, not a claim that a particular TFTWorks model is qualified for all listed instrument types.
| Instrument interface | Display priority | Integration question | Sample check |
|---|---|---|---|
| Numeric bench instrument | Clear digits, units and operating state | Does scaling preserve physical readability? | Long values, decimal points, units and held-data indicators |
| Multi-trace instrument | Useful plot area and distinguishable traces | Can the host render the required interface without disturbing other work? | Overlapping traces, cursors, menus and response delays |
| Rack-mounted instrument | Readability from expected positions | Does the complete optical stack work at installation angles? | Above, below and side viewing through the final cover |
| Portable service instrument | Ambient-light usability and power planning | What lighting, dimming and operating conditions apply? | Shadow, bright surroundings and intended power modes |
| Touch-driven instrument | Intentional input and precise controls | Which sensor, cover and controller configuration are used? | Edge targets, gestures and specified gloves |
Use the test-and-measurement application page for the product-selection path. This article addresses the engineering decisions needed to turn an application interest into a defined display requirement.
Treat resolution and color presentation as different choices
Native resolution establishes the pixel grid. It does not establish the instrument's vertical measurement resolution, input accuracy, trace-processing method or acquisition memory depth. Define those elsewhere in the instrument architecture and keep their evidence independent from the panel data sheet.
Color can distinguish traces and states, but should not be the only cue when the meaning is important. Pair colors with identifiers, line styles, symbols or text as appropriate to the interface. Review the result in normal and dimmed modes, through the final cover and from intended viewing positions. A color that appears distinct in a design tool may be difficult to distinguish in the assembled instrument.
Confirm that thin traces, grid lines and text render as intended at native timing. Check for unintended resampling, clipping and font artifacts. If the host uses a lower-resolution canvas scaled to the panel, understand the resulting trade-off rather than assuming that the native LCD pixel count is being used effectively.
For a 10.1-inch design, compare published configurations on their full specifications. The DS-T101BFHA-01CP 1920×1200 product page documents IPS, PCAP, optical bonding and dual-channel 8-bit LVDS with a 45-pin connector. It is a candidate configuration, not a qualification for a particular instrument or a promise of measurement performance.
Evaluate viewing angle through the final front stack
Compare the panel's documented viewing information with the installation geometry. A panel-type label is useful for shortlisting, but does not replace a physical review. Check numeric readings and trace distinction above, below and to either side of the actual front panel. Include cover reflections, the enclosure recess and any intended screen orientation.
Use representative ambient lighting. Laboratory overhead lights can reflect differently from field conditions or a studio lamp. If a portable instrument is used with polarized eyewear, include the relevant eyewear and orientation in validation. Record what was tested instead of making a universal claim about compatibility with all lenses.
Consider surface treatment and optical bonding as part of the same visual review. The AG, AR and optical-bonding comparison explains their different roles. Select the construction for the project's glare, clarity, cleaning and service requirements rather than treating one optical label as automatically superior for every instrument.
Budget host memory and responsiveness explicitly
Check the host's native video output, panel timing support and graphics memory format. The stored framebuffer format may differ from the transmitted color format. Layers, off-screen surfaces, textures and additional buffers consume resources beyond a single visible image. Evaluate the actual software architecture rather than deriving a processor requirement solely from panel resolution.
As a storage calculation example, one tightly packed 1280×800 RGB565 buffer needs 1280×800×2 = 2,048,000 bytes. One 1920×1200 buffer in the same format needs 4,608,000 bytes. These are allocations for the stated assumption, not instrument benchmarks. Stride padding and extra buffers must be added according to the host's implementation.
NXP's graphics and LCD introduction explains framebuffer organization and the use of shared memory resources for display refresh. Apply the current documentation for the actual host; examples for another processor do not establish its limits.
Test while acquisition, processing, logging and communication are active as applicable. Record interaction delays and visible behavior during demanding workloads. Distinguish the panel refresh rate, graphics redraw rate, trace-update behavior and input response. A smoothly animated test pattern is not proof that the production instrument has adequate scheduling or memory bandwidth.
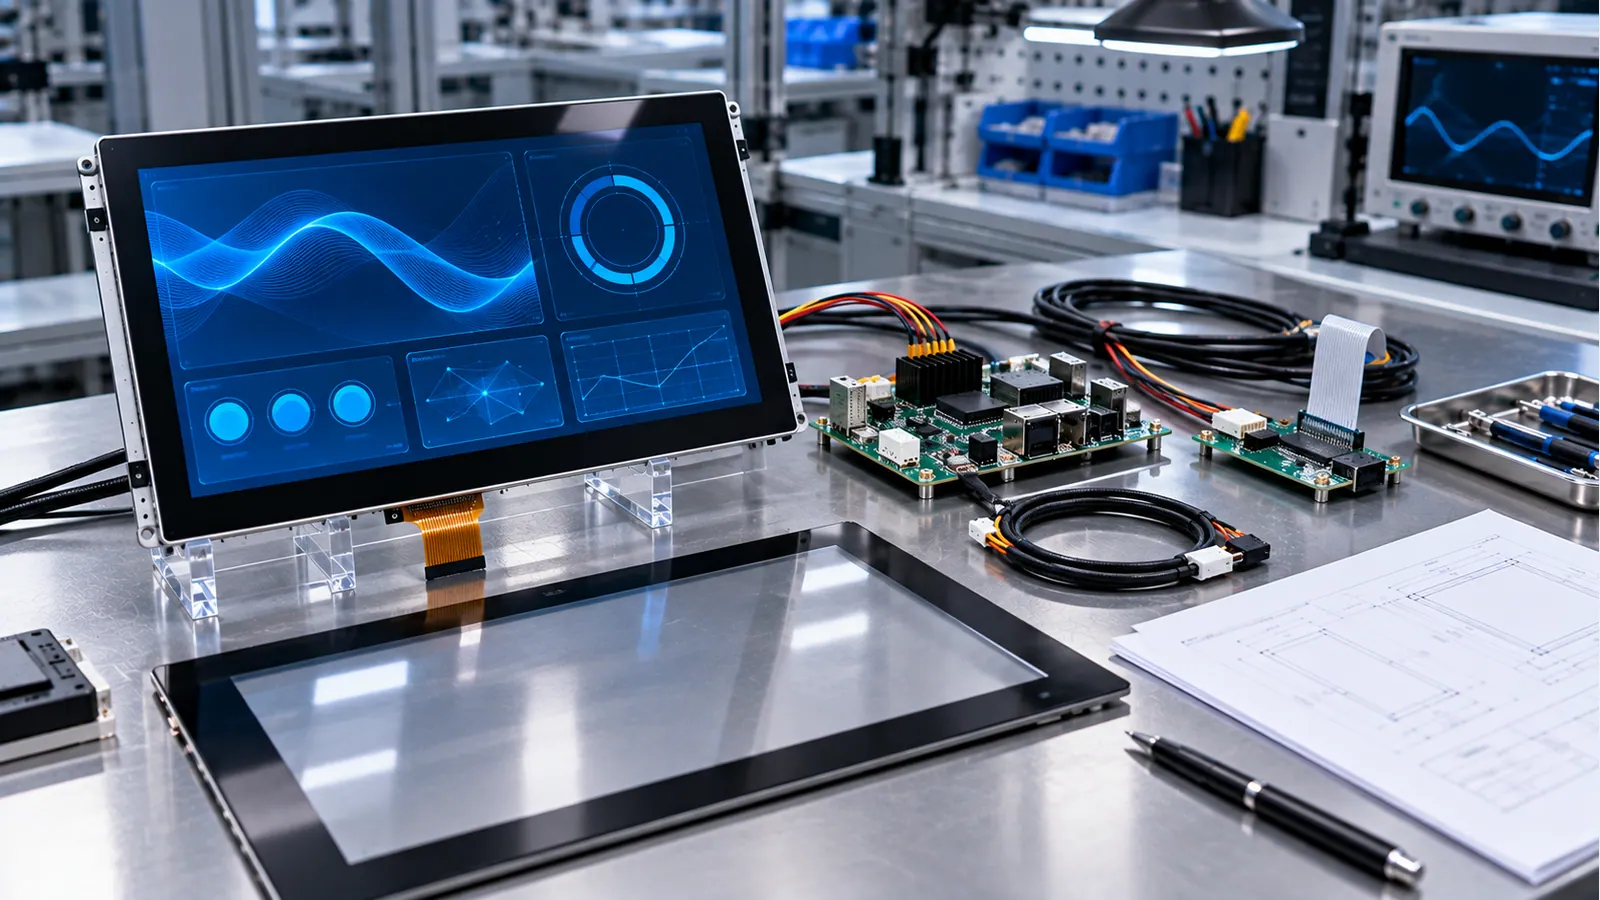
Close video, touch and backlight interfaces separately
Write a connection worksheet for video format, channel mapping, native timing, supply sequencing and connector orientation. If a controller or bridge board is needed, include its supported inputs, output timing, driver requirements and power conditions. The TFT controller-board selection guide helps organize this review, but the actual panel and board documents determine compatibility.
Confirm touch interface, interrupt behavior, coordinate mapping and startup separately. A correct picture can coexist with incorrect coordinates or a touch device that fails after suspend. Check the intended input methods, including physical controls when they are part of the instrument. Do not make critical interaction depend on an untested gesture.
Define backlight control and dimming behavior with the supplier. Include the intended power modes and thermal conditions. During system validation, review whether display operation changes the instrument's behavior in ways the instrument team considers unacceptable. Investigate such interactions using a controlled test plan, not by assuming that every backlight driver has the same effect.
A test-instrument display selection flow
- Identify the readings, traces, units and controls that must be visible together. If the busiest interface is not defined, resolve it before freezing resolution.
- Prototype physical-size screens at the intended viewing distance and installation angle. Determine whether more pixels improve readability or simply shrink the interface.
- Match native video, touch, timing and memory requirements to the host. Resolve unsupported paths before tooling or sample approval.
- Compare complete assemblies for optics, temperature, mechanics, power and service needs. Keep measurement-chain specifications outside the panel comparison.
- Validate production software and the complete front panel alongside representative instrument workloads. Freeze the configuration and record retest triggers.
The size-based TFT catalog can help when physical usability points toward a different diagonal. Do not rule out a size change merely because a higher-resolution screen fits the existing pixel-count target.
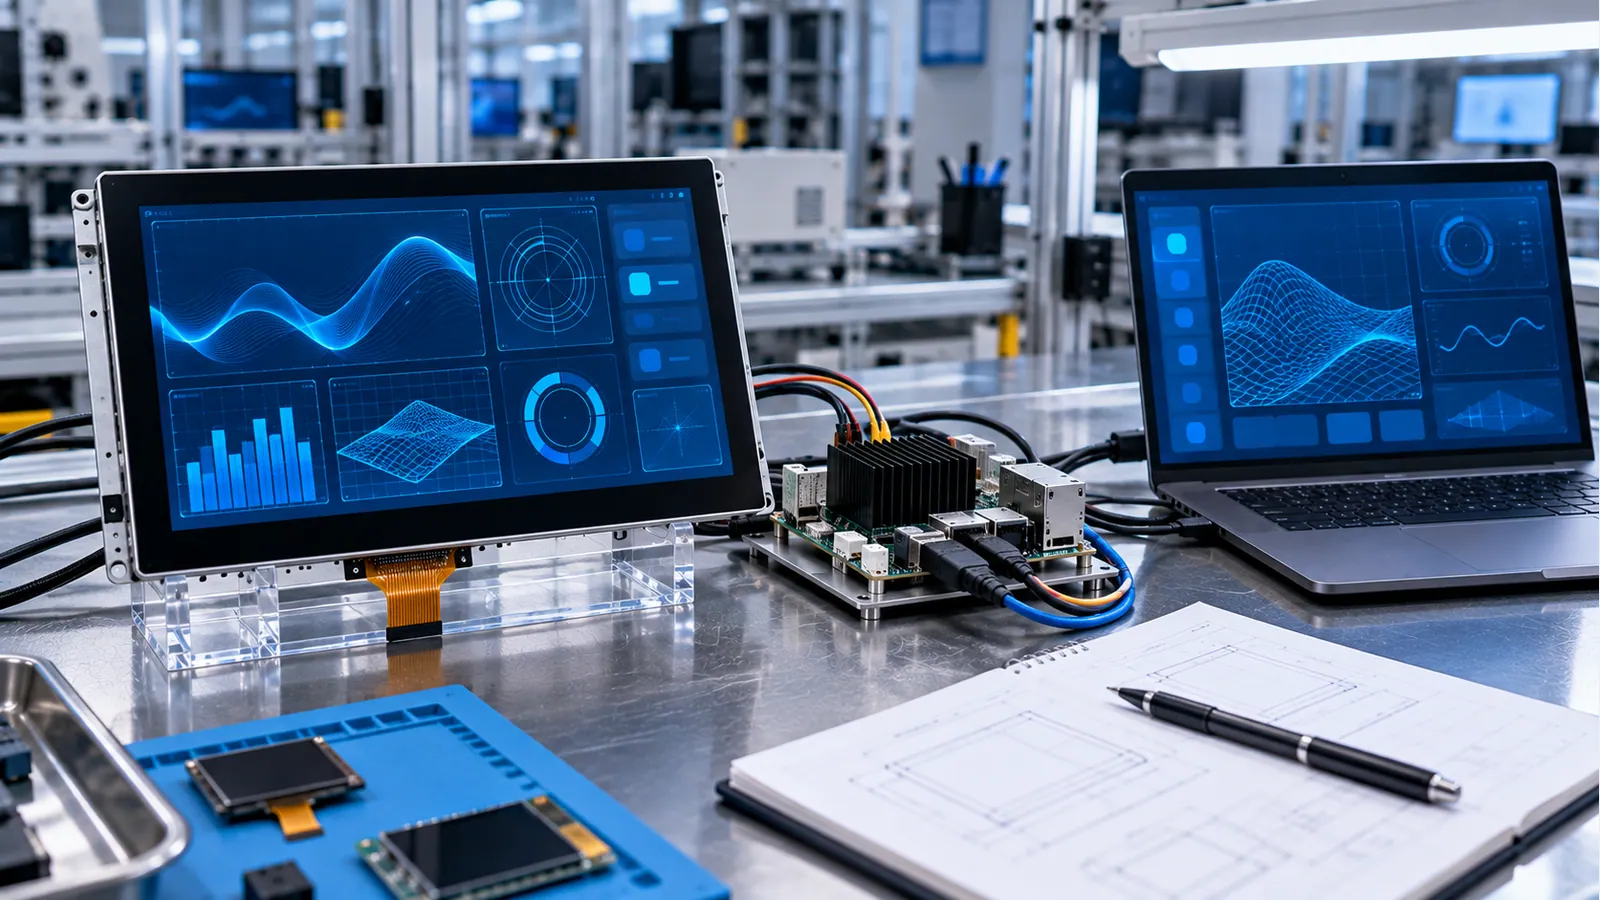
Display validation checklist for instrument release
- Record panel, cover, touch, controller, harness, host and software revisions.
- Inspect native image mapping with pixel markers, thin lines, gradients and edge boundaries.
- Review realistic numeric values, units, traces, cursor positions and translated controls.
- Test readability from intended positions in the specified ambient lighting and dimming modes.
- Exercise touch near borders and with defined gloves, recording both missed and unintended input.
- Run representative acquisition, processing and communication workloads while recording interface response.
- Verify startup, power cycling, sleep transitions and the user-visible behavior after an interrupted connection.
- Review display and backlight operation within the instrument team's system test program.
- Inspect mechanical clearances, cable retention and the proposed service replacement workflow.
- Define which hardware, firmware, optical-stack or driver changes require requalification of the affected functions.
Keep display-test evidence separate from calibration or measurement-performance evidence. A panel can pass its optical and functional checks while the instrument still requires its own accuracy, environmental and electrical validation. Avoid summarizing all of those independent results as “the display passed.”
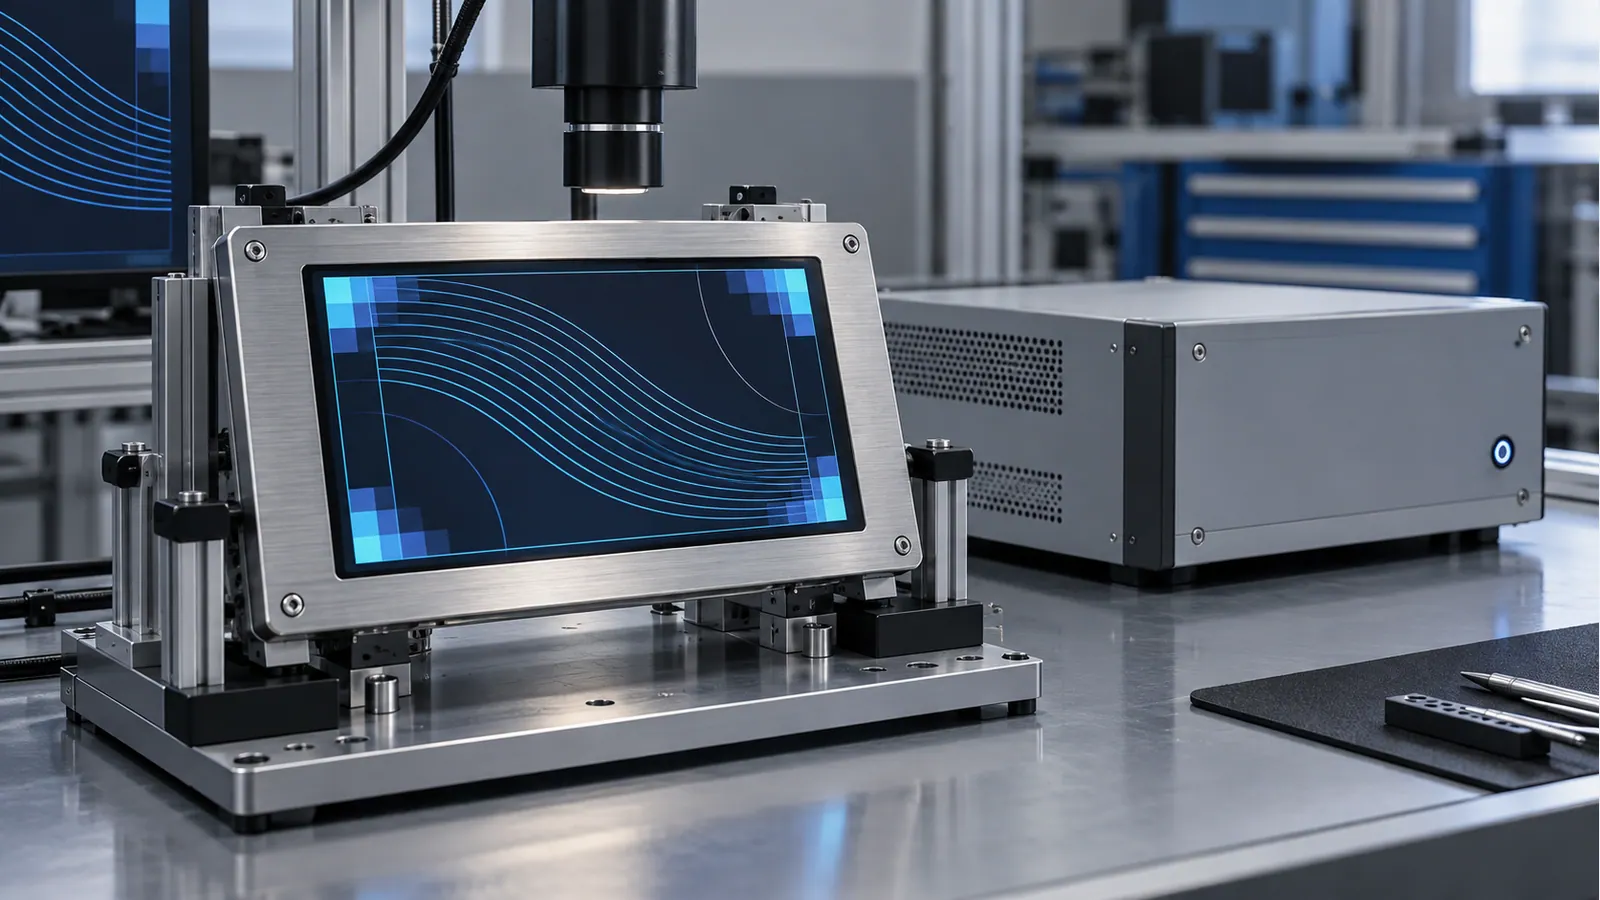
Frequently asked questions
Does a higher-resolution TFT improve measurement accuracy?
Not by itself. It changes the image-rendering grid. Acquisition, processing and calibration determine the instrument's measurement performance. More display pixels may improve presentation when the software uses them effectively, but cannot establish a new accuracy specification.
Is IPS always required for test equipment?
No. Shortlist using the intended viewing geometry and documented optical behavior, then evaluate the complete front stack. The task, lighting, mounting position and other constraints decide what is suitable; a panel-type label is not a universal requirement.
Are display refresh rate and waveform update rate the same?
No. Panel refresh, graphics redraw and instrument trace updates describe different parts of the system. Specify and test the relevant behavior separately. A panel timing value does not prove an instrument acquisition or trace-update capability.
Can a generic controller board drive any TFT of the same size?
No. Match panel interface, timing, channel mapping, supply and connector pinout to the documented board capability. Diagonal size and resolution alone are insufficient. Confirm touch support separately if touch is required.
What should be included in an instrument-display RFQ?
Send host details, representative screens, required viewing positions, enclosure drawings, ambient-light and temperature conditions, touch requirements and service plans. Explain which performance requirements belong to the display and which belong to the instrument architecture.
Continue the display architecture review
Use the 10.1-inch resolution comparison for a concrete same-size panel example, while keeping measurement accuracy separate from the display. For a panel integrated into industrial controls, the factory-automation HMI guide explains the distinct display, host and machine-controller boundaries.
Request a test-instrument display review
Submit the interface and assembly requirements through the project review form. Clear separation of measurement, graphics and display requirements gives engineering a useful basis for shortlisting modules without claiming performance that a panel specification cannot establish.